
There is a specific moment in every infrastructure incident when you realise you are flying blind. A service is degraded, users are affected, and your first reflex — opening vCenter — gives you CPU, memory and network graphs that show nothing obviously wrong. Meanwhile, something at the application layer is silently failing.
That moment is what observability is designed to prevent. And yet, the majority of VCF platforms I encounter are instrumented for infrastructure-layer visibility only. The Kubernetes workloads running on top generate a sea of data — events, logs, metrics, traces — that nobody is collecting systematically.
This article establishes the conceptual framework. Before deploying Prometheus or configuring Fluent Bit, you need a precise understanding of what each observability signal is, what it cannot tell you, and how the three signals compose into a coherent picture. The OpenTelemetry project has done the work of formalising these definitions. We will use them as our reference.
The OpenTelemetry specification: a common vocabulary
The OpenTelemetry specification is the CNCF-backed effort to standardise how observability data is generated, collected, and transmitted. Its value is not primarily in the tooling — it is in the vocabulary it provides. When you say “span”, “trace”, “metric point” or “log record” in an OTel context, everyone in the room means the same thing.
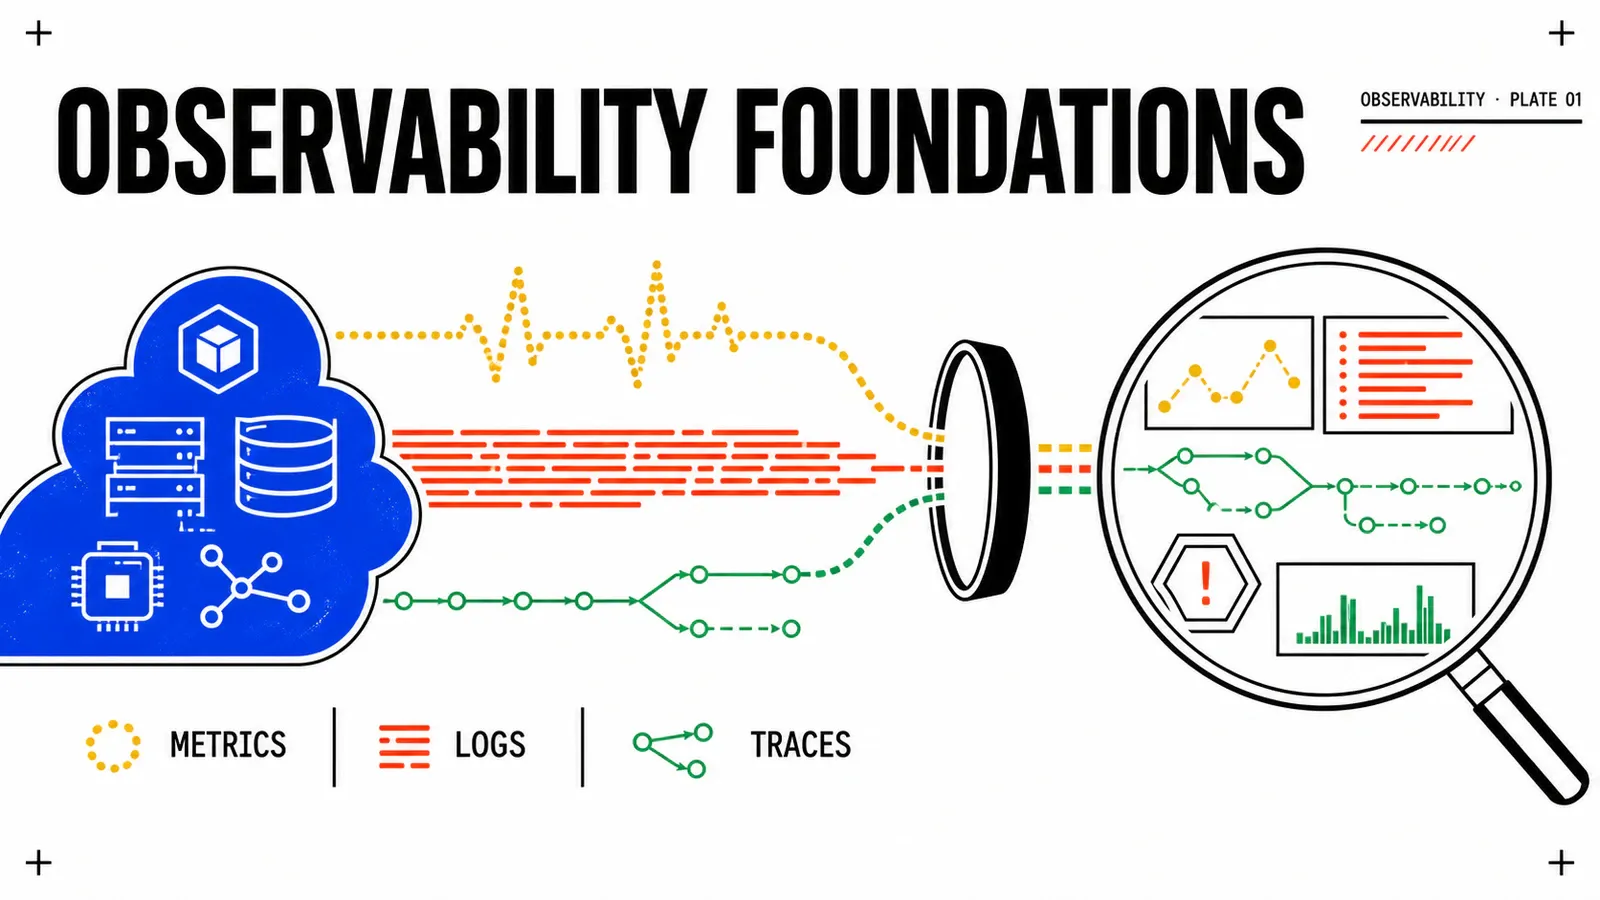
The specification distinguishes three signal types, each with a distinct data model and semantic.
Metrics — A measurement captured at a point in time, aggregated over a series of points. The OTel metric data model defines six instrument kinds: Counter, UpDownCounter, Gauge, Histogram, ObservableCounter, and ObservableGauge. A metric point carries a value, a timestamp, and a set of attributes (labels). Metrics are the most compact signal: they lose individual event detail in exchange for efficient aggregation and long-term retention.
Logs — A record of a discrete event. The OTel log data model defines a LogRecord with a timestamp, observed timestamp, trace context (traceId, spanId), severity number, severity text, body, and attributes. Logs carry the richest context per event, but at the cost of volume — a busy cluster produces millions of log lines per minute.
Traces — A record of a distributed request’s journey across services. A trace is a directed acyclic graph of spans. Each span has a name, a start/end timestamp, a status, attributes, events, and links. The trace model is what makes distributed debugging possible: you can follow a single user request from the API gateway through five microservices and identify exactly which database call added 400ms.
The three signals are not alternatives to each other. They are complementary. A metric alert tells you that something is wrong. Logs tell you what happened. A trace tells you where the latency or error originated in the call graph.
Why VCF environments need all three layers
A common mistake in platform teams is to equate observability with monitoring. Monitoring is the practice of watching known failure modes — setting thresholds on metrics you already understand. Observability is the property of a system that allows you to ask arbitrary questions about its internal state from its external outputs.
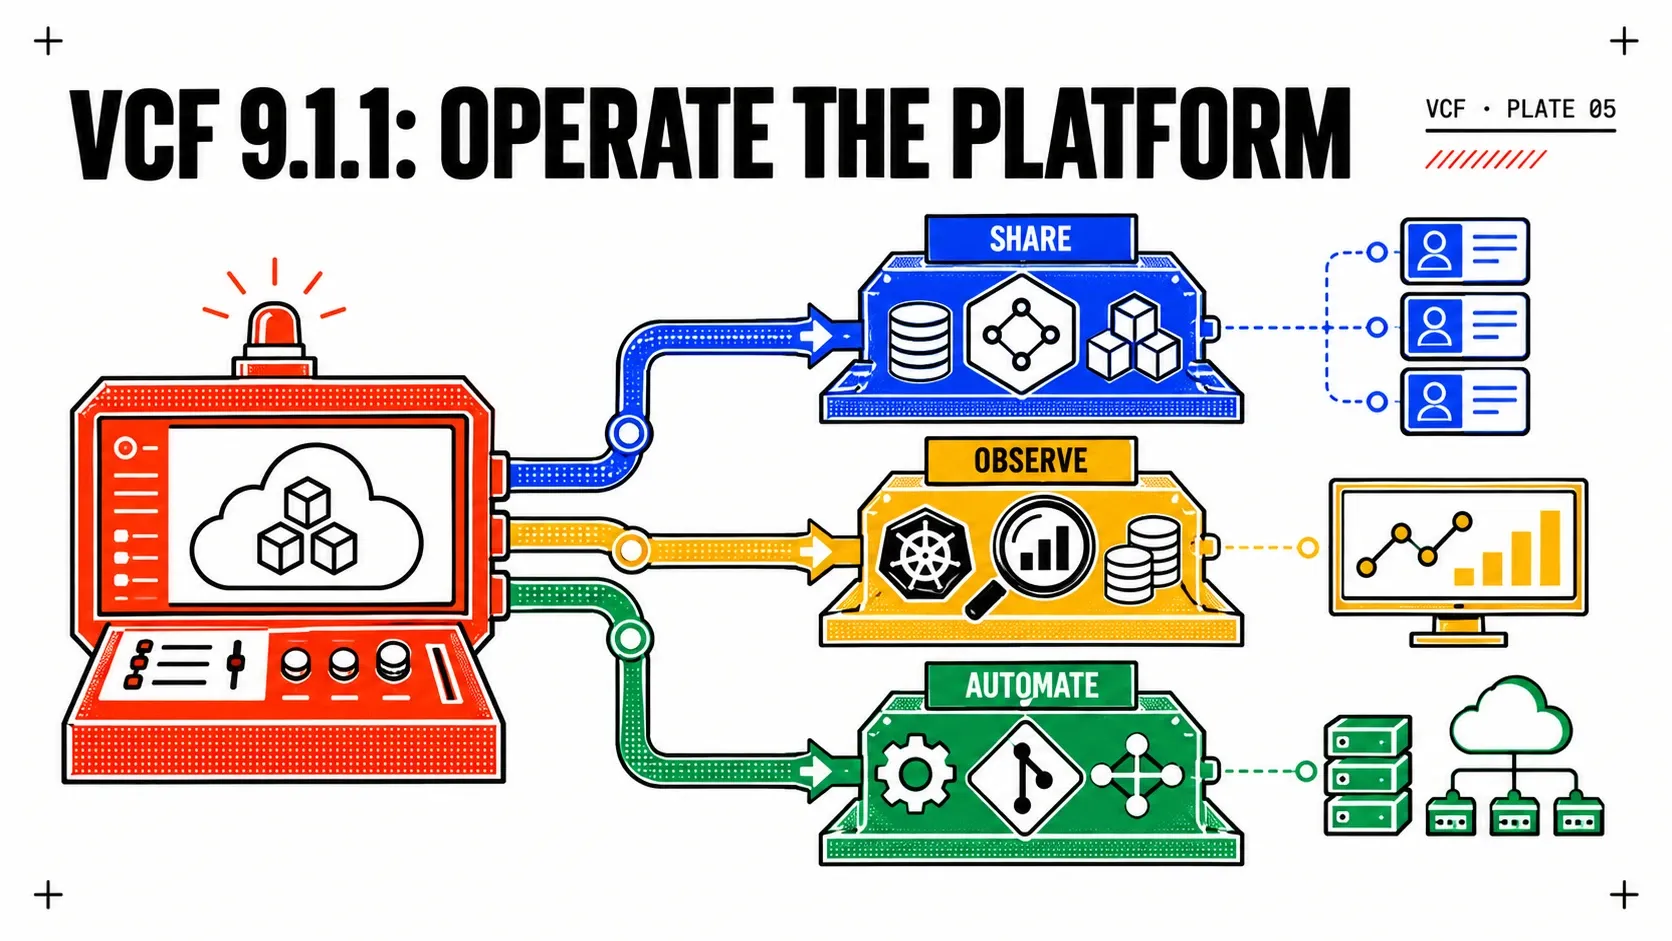
VCF platforms combine multiple layers with very different operational characteristics. The hypervisor layer (ESXi, vSAN, NSX) is managed and emits structured metrics via the vSphere API and Aria Operations. The Kubernetes control plane (Supervisor, VKS clusters) exposes metrics via the /metrics endpoint on its components. The application workloads running inside pods are largely opaque unless instrumented.
The gap nobody fixes
Aria Operations and vROps give you excellent infrastructure visibility. They do not give you distributed traces. They do not give you structured application logs. The first time a developer asks “why is my API slow?” and you have no traces, you will understand the gap.
Each layer requires a different collection mechanism:
- ESXi and vSAN metrics are available via Aria Operations (vROps) or via the vSphere API polled by exporters like
vsphere-exporterfor Prometheus. - Kubernetes component metrics (kube-apiserver, etcd, kubelet, kube-scheduler) are scraped directly by Prometheus using ServiceMonitor resources.
- Application metrics require either auto-instrumentation (OTel Java/Python/Go agents) or explicit SDK calls from application code.
- Logs from pods are written to stdout/stderr and collected by a DaemonSet (Fluent Bit, Fluentd, or Vector) forwarding to a log aggregation backend.
- Traces require instrumentation — either via OTel language SDKs or via service mesh-level tracing (Istio, Linkerd) that captures span data at the proxy level.
Architecture of reference for VCF + VKS
The architecture that works for a production VCF platform combines two collection layers.
The first layer is the infrastructure layer: Aria Operations collects host, cluster, datastore and NSX metrics. These metrics cover resource contention, vSAN performance, network saturation, and platform-level events. Aria Operations is the authoritative source for infra-layer visibility.
The second layer is the cloud-native layer: a Prometheus stack (kube-prometheus-stack via Helm) running inside each VKS cluster collects Kubernetes component metrics, node metrics (via node-exporter), and application metrics. Grafana provides dashboards correlating both layers via remote_write from Aria Operations.
Fluent Bit runs as a DaemonSet in each VKS cluster, collecting pod logs and forwarding to Loki. The OpenTelemetry Collector runs as a Deployment receiving OTLP from instrumented applications and forwarding traces to Tempo or Jaeger.
ESXi / vSAN / NSX
       │
  Aria Operations ──── remote_write ──── Prometheus
       │                                      │
   vROps API                              Grafana
                                         │       │
                                       Loki    Tempo
                                         │       │
                                    Fluent Bit  OTel Collector
                                         │       │
                                      VKS pods ──┘
This architecture avoids the trap of deploying a single massive observability platform for the entire VCF estate. Instead, it composes specialised tools: Aria Operations for infrastructure, Prometheus for Kubernetes metrics, Loki for logs, Tempo for traces, unified under Grafana as the single query and dashboard layer.
Choosing the right tool for each signal
The tool selection question is frequently overcomplicated. The principles are simple.
Metrics: Prometheus vs Aria Operations vs InfluxDB
Logs: Loki vs Elasticsearch vs Splunk
Traces: Jaeger vs Tempo vs Zipkin
Collection: OpenTelemetry Collector vs language-specific agents
The four golden signals and where to apply them
The four golden signals — latency, traffic, errors, and saturation — were defined by Google’s SRE book as the minimum instrumentation required for production service readiness. They map onto the three observability pillars in a predictable way.
Latency is best measured with traces (P50/P95/P99 at the span level) and histograms (Prometheus _bucket metrics). Logs can record latency per request but aggregate poorly.
Traffic is a metric signal: requests per second, bytes per second, events per second. Prometheus counters are the natural fit.
Errors live in both metrics (error rate counters) and logs (error-level log records). Traces carry error status on spans, enabling you to correlate “this trace contains an error” with the specific service responsible.
Saturation is primarily an infrastructure metric: CPU ready time, memory pressure, disk queue depth, network buffer drops. These come from the infrastructure layer — Aria Operations or node-exporter — rather than from application instrumentation.
Getting started without boiling the ocean
The most common failure mode in observability projects is attempting to instrument everything simultaneously. The result is a months-long deployment that delivers no value until everything is complete.
The pragmatic approach is to start with the two signals that deliver the fastest time-to-value for production operations. Metrics first — deploy kube-prometheus-stack with the default scrape configuration and you immediately have Kubernetes component health, node resource usage, and pod restart counts without writing a single line of application code. Logs second — a Fluent Bit DaemonSet with the Kubernetes metadata filter gives you structured pod logs with namespace, pod name, container name and node labels immediately queryable in Loki.
Traces come last, because they require application instrumentation. Auto-instrumentation agents for Java, Python, Go and Node.js can reduce the overhead significantly, but they still require a deployment change per application. Reserve distributed tracing for services where latency analysis is a documented production requirement.
The following articles in this series cover each layer in detail: Prometheus and Grafana deployment patterns for VKS in the next article, Loki and Fluent Bit configuration in the third, OpenTelemetry Collector pipeline design in the fourth, and Aria Operations integration with the open-source stack in the fifth.
References.
- OpenTelemetry Specification — Signals — authoritative definitions of metric, log and trace data models
- CNCF Observability Whitepaper — vendor-neutral observability patterns for cloud-native platforms
- Google SRE Book — Monitoring Distributed Systems — four golden signals and the alert philosophy behind them
- Prometheus Data Model — label-based time series, metric types and naming conventions
- Broadcom TechDocs — Aria Operations — official reference for vSphere infrastructure metrics
Get the next one by email
New articles and series, sent when they are published. No other mail.