
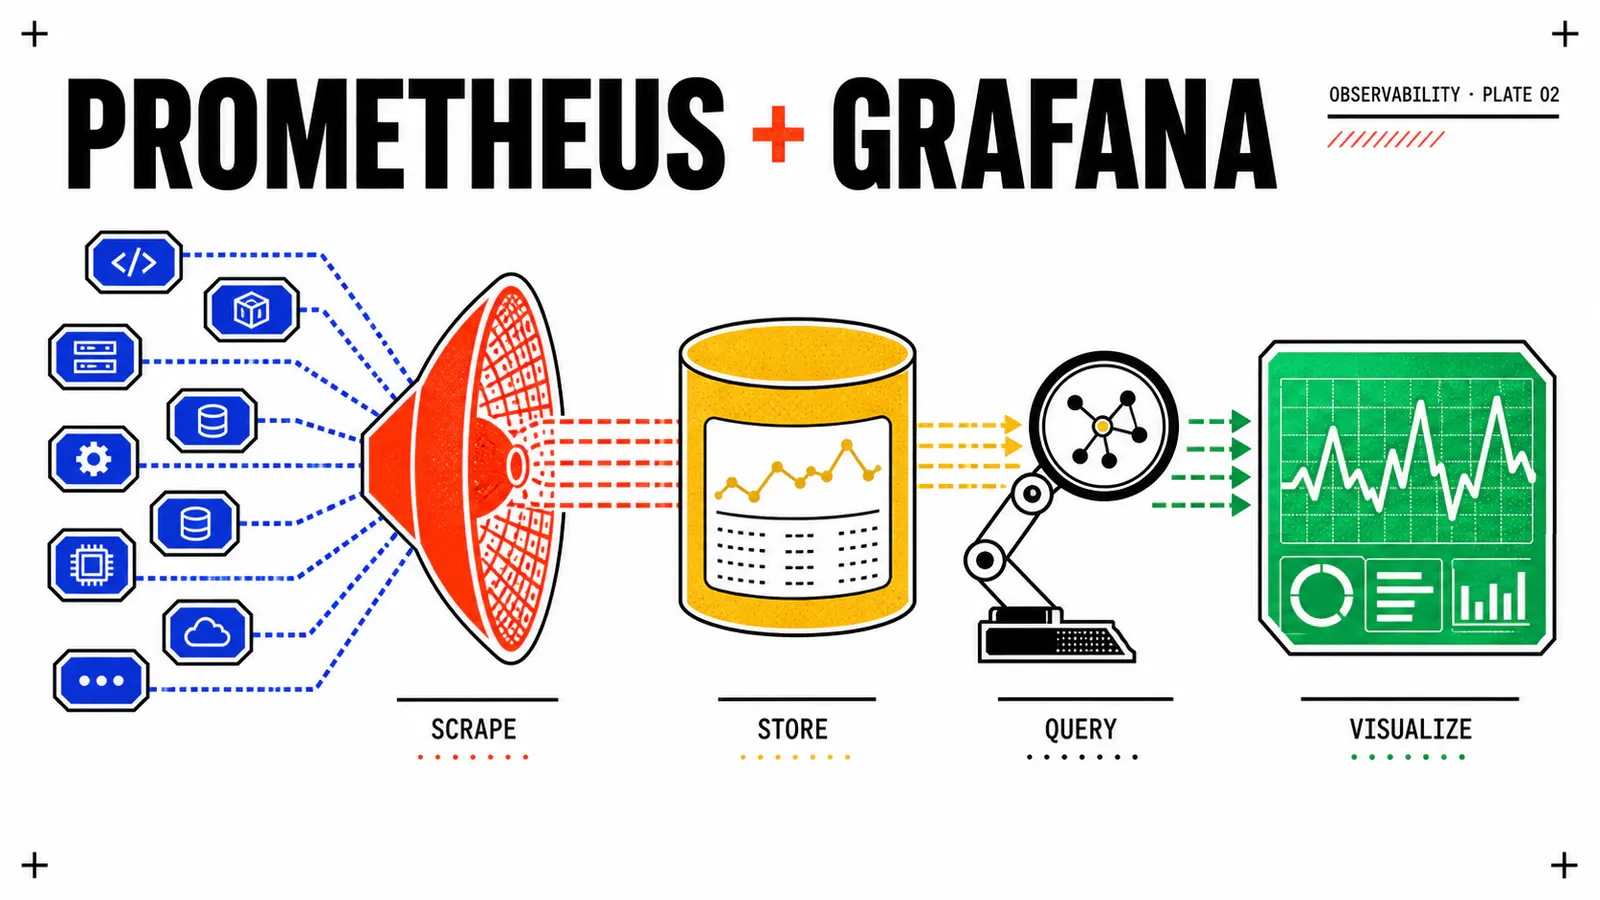
Prometheus has been the de-facto Kubernetes monitoring standard since it graduated from the CNCF in 2018. Every Kubernetes component exposes a /metrics endpoint. Every observability tool in the ecosystem speaks Prometheus’s exposition format. The question for a VKS deployment is not whether to use Prometheus, but how to deploy and configure it for production.
This article covers the full deployment lifecycle: installing kube-prometheus-stack via Helm with annotated values, configuring ServiceMonitor and PodMonitor resources to instrument your applications, setting up Alertmanager routing, and connecting Grafana to the essential dashboards. We skip the toy configuration and go directly to the patterns that survive contact with production.
The Prometheus data model
Before touching a single YAML file, understanding the data model is essential. The Prometheus data model defines a time series as a set of timestamped float64 values identified by a metric name and a set of key-value labels.
# HELP node_cpu_seconds_total Seconds the CPU spent in each mode.
# TYPE node_cpu_seconds_total counter
node_cpu_seconds_total{cpu="0",mode="idle"} 72891.43
node_cpu_seconds_total{cpu="0",mode="system"} 842.17
node_cpu_seconds_total{cpu="1",mode="idle"} 71934.88
The metric name and labels together uniquely identify a time series. Cardinality — the number of unique label value combinations — determines memory consumption. High cardinality (for example, a label containing a request UUID) can exhaust Prometheus memory. Keep label values bounded: namespace, pod, container, node are good labels; request IDs are not.
Prometheus defines four core metric types:
- Counter — monotonically increasing value (request count, error count). Never decreases except on restart.
- Gauge — value that can go up or down (memory usage, active connections, temperature).
- Histogram — sample observations bucketed into configurable ranges (request duration, response size). Exposes
_bucket,_sum, and_countseries. Used for quantile calculations. - Summary — similar to histogram but calculates quantiles client-side. Prefer histograms for most use cases — they can be aggregated across replicas, summaries cannot.
The Prometheus Operator extends this model with Exemplars: sample observations that carry a trace ID, enabling correlation from a histogram observation directly to the distributed trace in Tempo or Jaeger.
Deploying kube-prometheus-stack
The kube-prometheus-stack Helm chart bundles Prometheus, Alertmanager, Grafana, node-exporter, kube-state-metrics, and the Prometheus Operator. It is the standard installation path for production clusters.
helm repo add prometheus-community https://prometheus-community.github.io/helm-charts
helm repo update

helm upgrade --install kube-prometheus-stack prometheus-community/kube-prometheus-stack \
  --namespace monitoring \
  --create-namespace \
  --values prometheus-values.yaml \
  --version 65.x
The prometheus-values.yaml file is where the production configuration lives. The defaults work for a demo but need adjustment for VKS:
# prometheus-values.yaml — production configuration for VKS
prometheus:
  prometheusSpec:
    # Retention: 15 days local, remote_write for long-term
    retention: 15d
    retentionSize: "45GB"

    # Storage: use the vSAN storage policy for TSDB
    storageSpec:
      volumeClaimTemplate:
        spec:
          storageClassName: vsan-default-storage-policy
          accessModes: ["ReadWriteOnce"]
          resources:
            requests:
              storage: 50Gi

    # Resource limits: calibrated for 300 targets / 1M active series
    resources:
      requests:
        cpu: 500m
        memory: 2Gi
      limits:
        cpu: 2000m
        memory: 6Gi

    # Scrape interval: 30s is the production default
    scrapeInterval: 30s
    evaluationInterval: 30s

    # IMPORTANT: watch ServiceMonitors across all namespaces
    serviceMonitorSelectorNilUsesHelmValues: false
    serviceMonitorNamespaceSelector: {}
    serviceMonitorSelector: {}
    podMonitorSelectorNilUsesHelmValues: false
    podMonitorNamespaceSelector: {}
    podMonitorSelector: {}

    # Exemplar storage (for trace correlation)
    enableFeatures:
      - exemplar-storage

alertmanager:
  alertmanagerSpec:
    storage:
      volumeClaimTemplate:
        spec:
          storageClassName: vsan-default-storage-policy
          accessModes: ["ReadWriteOnce"]
          resources:
            requests:
              storage: 5Gi

grafana:
  persistence:
    enabled: true
    storageClassName: vsan-default-storage-policy
    size: 10Gi
  # Admin password via secret — never hardcode
  adminPasswordSecret: grafana-admin-secret
  adminPasswordSecretKey: password

nodeExporter:
  enabled: true

kubeStateMetrics:
  enabled: true
serviceMonitorSelectorNilUsesHelmValues
The two serviceMonitorSelectorNilUsesHelmValues: false and their namespace equivalents are critical. Without them, Prometheus only watches ServiceMonitors in the same namespace as the Helm release. Your application teams will create ServiceMonitors in their own namespaces and wonder why metrics never appear.
ServiceMonitor and PodMonitor schemas
The Prometheus Operator defines two custom resources for configuring scrape targets: ServiceMonitor targets Kubernetes Services, PodMonitor targets pods directly.
ServiceMonitor (monitoring.coreos.com/v1)
apiVersion: monitoring.coreos.com/v1
kind: ServiceMonitor
metadata:
  name: my-api-metrics
  namespace: production
  labels:
    # These labels must match the serviceMonitorSelector in PrometheusSpec
    release: kube-prometheus-stack
spec:
  # Select the Service to scrape
  selector:
    matchLabels:
      app: my-api
  namespaceSelector:
    matchNames:
      - production
  endpoints:
    - port: metrics          # Named port on the Service
      interval: 30s
      path: /metrics
      scheme: http
      # TLS config if the endpoint is HTTPS
      # tlsConfig:
      #   insecureSkipVerify: true
      # Relabeling: drop high-cardinality labels before storage
      metricRelabelings:
        - sourceLabels: [__name__]
          regex: "go_.*"
          action: drop        # Drop Go runtime metrics to reduce cardinality
PodMonitor (monitoring.coreos.com/v1)
Use PodMonitor when there is no Kubernetes Service in front of the pods — for example, batch jobs or pods that expose metrics but don’t need load balancing.
apiVersion: monitoring.coreos.com/v1
kind: PodMonitor
metadata:
  name: batch-job-metrics
  namespace: processing
spec:
  selector:
    matchLabels:
      app: batch-processor
  podMetricsEndpoints:
    - port: metrics
      interval: 60s     # Longer interval for batch jobs
      path: /metrics
Named ports are required
The ServiceMonitor and PodMonitor reference ports by name, not by number. The port must be declared as a named port on the Service or Pod spec. containerPort: 9090 alone is insufficient — you need name: metrics alongside it.
Essential alerting rules
Prometheus evaluates recording and alerting rules against the collected time series on a configurable interval. The Prometheus Operator uses PrometheusRule custom resources.
apiVersion: monitoring.coreos.com/v1
kind: PrometheusRule
metadata:
  name: platform-alerts
  namespace: monitoring
  labels:
    release: kube-prometheus-stack
spec:
  groups:
    - name: kubernetes.workload
      interval: 30s
      rules:
        # Alert when pod restart count is high
        - alert: PodRestartingFrequently
          expr: |
            increase(kube_pod_container_status_restarts_total[15m]) > 3
          for: 5m
          labels:
            severity: warning
          annotations:
            summary: "Pod {{ $labels.pod }} restarting frequently"
            description: "{{ $labels.container }} in {{ $labels.namespace }}/{{ $labels.pod }} restarted {{ $value }} times in 15m"

        # Alert when deployment replicas mismatch
        - alert: DeploymentReplicasMismatch
          expr: |
            kube_deployment_spec_replicas != kube_deployment_status_available_replicas
          for: 10m
          labels:
            severity: critical
          annotations:
            summary: "Deployment {{ $labels.deployment }} replica mismatch"

    - name: kubernetes.resource
      rules:
        # Recording rule for CPU usage percentage
        - record: node:cpu_utilization:rate5m
          expr: |
            1 - avg by(node) (rate(node_cpu_seconds_total{mode="idle"}[5m]))
Grafana dashboards: the essential five
The Grafana dashboard library provides community-maintained dashboards that work with kube-prometheus-stack out of the box. Import by ID from the Grafana UI (+ → Import → Enter dashboard ID).
Dashboard 15760 — Kubernetes / Views / Global. Cluster-wide overview: pod counts, deployment health, node resource pressure, PVC usage. The single-pane starting point for any incident.
Dashboard 15757 — Kubernetes / Views / Namespaces. Per-namespace breakdown of CPU, memory, pod counts and network I/O. Useful for chargeback and capacity planning conversations.
Dashboard 15758 — Kubernetes / Views / Workloads. Individual deployment/statefulset/daemonset performance with drill-down to pod level.
Dashboard 1860 — Node Exporter Full. The reference dashboard for physical/virtual node metrics: CPU usage per mode, memory breakdown (buffers/cache/available), disk I/O, network traffic, filesystem usage. Works with the node-exporter bundled in kube-prometheus-stack.
Dashboard 7587 — Prometheus 2.0 Overview. Meta-monitoring: Prometheus’s own performance — scrape duration, TSDB head size, rule evaluation latency, WAL truncation. Essential to catch Prometheus itself becoming a bottleneck.
Dashboard 9578 — Alertmanager. Active alerts, silences, inhibitions, and routing tree visualization. The operational center for alert management. Pair with a PagerDuty or Slack integration configured in the Alertmanager routes.
Retention and storage sizing
Prometheus stores time series in a local TSDB (time series database) with a write-ahead log and periodic compactions. Sizing follows a formula based on active series and retention duration.
For a cluster with 300 scrape targets and a 30-second scrape interval:
- Average bytes per sample: ~1.5 bytes (after TSDB compression)
- Active series estimate: 300 targets × 2,000 metrics/target = 600,000 series
- 15-day retention at 30s interval: 600,000 × (15d × 24h × 120 samples/h) × 1.5 bytes ≈ 46 GB
This matches the retentionSize: "45GB" in the values file above. For longer retention, the standard approach is remote_write to a long-term backend: Thanos, Cortex, VictoriaMetrics, or Mimir. These backends store compressed blocks in object storage (S3 or vSAN Object Storage) and expose a Prometheus-compatible query API to Grafana.
VKS storage class for Prometheus TSDB
The TSDB write pattern is sequential write-heavy with random reads during queries. vSAN RAID-5 or RAID-6 policies perform well here. Avoid using a Retain reclaim policy — a deleted Prometheus pod should not leave orphaned 50 GB PVCs in the datastore.
Scaling considerations for large VCF estates
A single Prometheus instance scraping 300 targets with 600K active series comfortably fits in 4 GB of RAM. At 3,000 targets or 6M series, you need to shard. The Prometheus Operator supports horizontal sharding via shards in PrometheusSpec.
For multi-cluster VCF estates, the recommended pattern is one Prometheus per VKS cluster (federated scraping creates bottlenecks and single points of failure) with a centralised Grafana using remote_write from each cluster to a shared Thanos or Mimir instance. This gives you per-cluster isolation with cross-cluster querying and dashboards in one place.
References.
- Prometheus Data Model — authoritative reference for labels, metric types and cardinality
- Prometheus Operator API Reference — ServiceMonitor, PodMonitor, PrometheusRule, Alertmanager CRDs
- kube-prometheus-stack Helm chart — chart values documentation
- Grafana Dashboard Library — community dashboards for Kubernetes and node-exporter
- Prometheus Storage documentation — TSDB internals, WAL, compaction, remote storage
Get the next one by email
New articles and series, sent when they are published. No other mail.