
The Elasticsearch, Logstash, Kibana stack was the standard answer to log aggregation for the better part of a decade. It still works. But for teams running Kubernetes on VCF, its operational cost — memory-hungry Elasticsearch nodes, complex index management, slow cold queries — has become a legitimate problem.
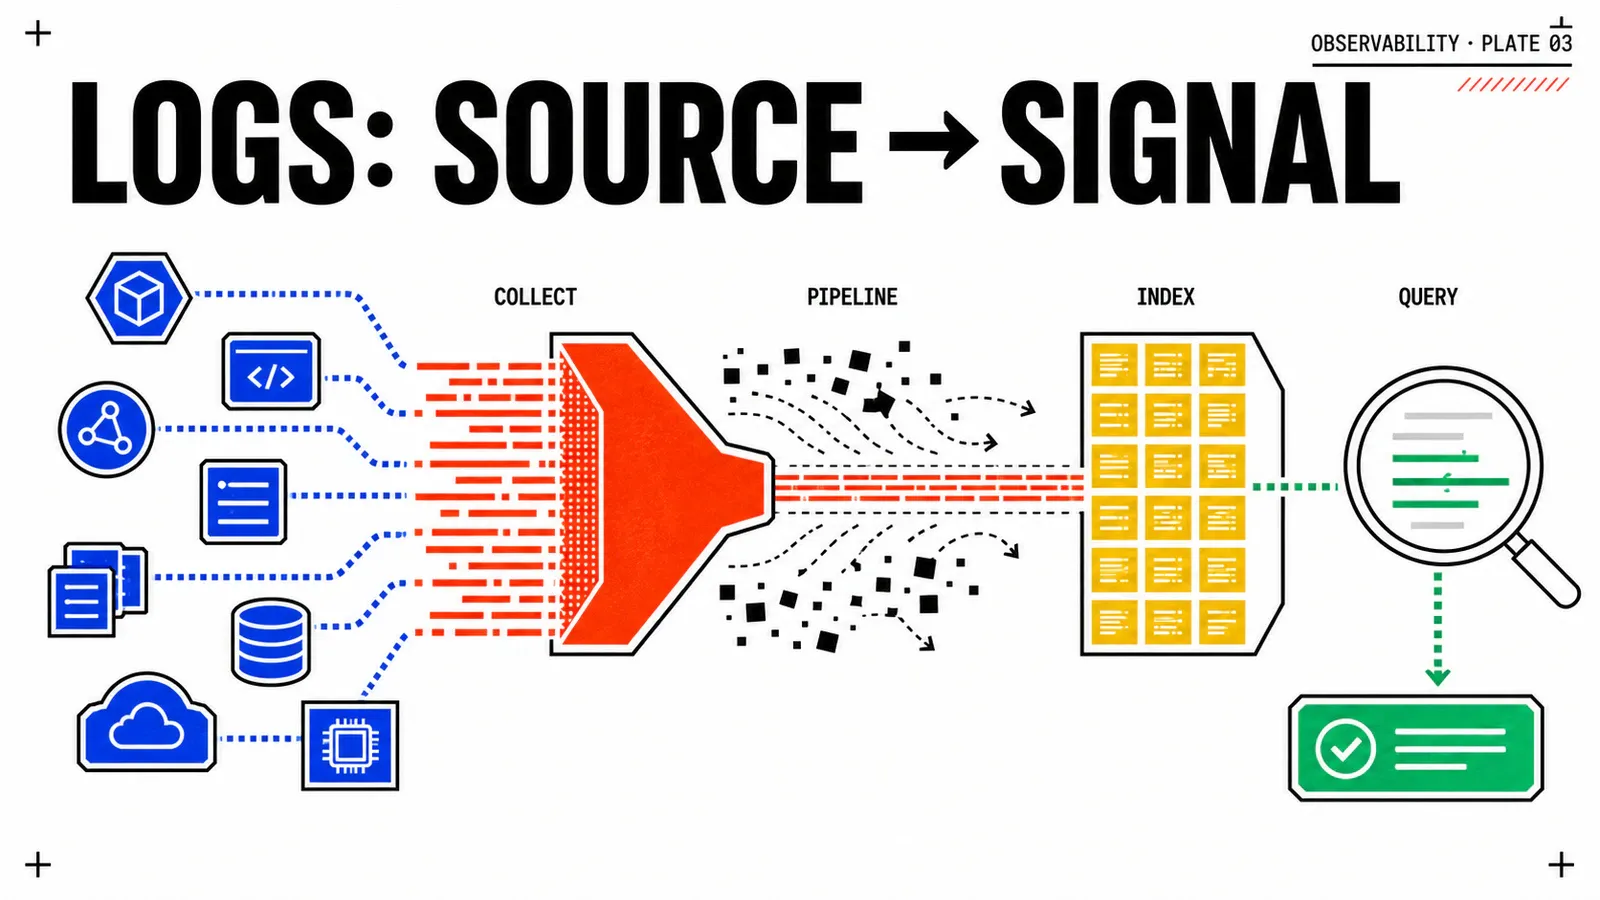
The PLG stack (Promtail or Fluent Bit, Loki, Grafana) trades full-text indexing for label-based indexing and delivers a 10 to 20 times reduction in storage cost for typical Kubernetes log volumes. The trade-off is real: without full-text search, you cannot grep inside the log body using the index. You can filter on labels and use regex inside LogQL queries, but that scans chunks rather than hitting an index. For platform teams where 90% of queries are “show me all error logs from pod X in namespace Y”, the trade is worthwhile.
Loki architecture
Loki is a log aggregation system inspired by Prometheus. Its key design decision is to store only the labels as an index and the log content as compressed chunks in object storage.
A production Loki deployment is composed of five main components:
Distributor — receives log streams from clients (Fluent Bit, Promtail, OTel Collector). Validates the stream structure, applies ingest limits, and fans out to ingesters. The distributor is the write path entry point and is stateless.
Ingester — holds incoming log chunks in memory until they reach a configurable flush interval (default: 5 minutes) or size threshold, then writes them to object storage. The ingester also answers recent-data queries before chunks are flushed. It is stateful — you must run at least 3 ingesters with a replication factor of 2 or 3 for production resilience.
Querier — handles LogQL queries by fetching chunks from both ingesters (recent data) and object storage (historical data), then applying filter and metric expressions locally. Scales horizontally.
Compactor — runs retention policies, deduplication, and index compaction. A single-replica background process; not in the hot query path.
Query Frontend (optional but recommended) — sits in front of queriers, splits large time-range queries into smaller parallel sub-queries, caches results. Significantly improves query performance for large time ranges.
Loki in monolithic vs microservices mode
The Helm chart defaults to monolithic mode (all components in one process) for development. For production on VKS, switch to microservices mode or at minimum to the simple-scalable target, which splits read and write paths into separate deployments that scale independently.
Loki deployment on VKS
helm repo add grafana https://grafana.github.io/helm-charts
helm repo update

helm upgrade --install loki grafana/loki \
  --namespace logging \
  --create-namespace \
  --values loki-values.yaml \
  --version 6.x
# loki-values.yaml — production on VKS
loki:
auth_enabled: false # Enable multi-tenant in regulated environments
commonConfig:
replication_factor: 2
storage:
type: filesystem # Use s3 or gcs for large-scale; filesystem for medium clusters
filesystem:
chunks_directory: /var/loki/chunks
rules_directory: /var/loki/rules
limits_config:
ingestion_rate_mb: 16 # Per-tenant ingest rate limit
ingestion_burst_size_mb: 32
max_label_names_per_series: 15
max_entries_limit_per_query: 5000
retention_period: 744h # 31 days
schema_config:
configs:
- from: "2024-01-01"
store: tsdb
object_store: filesystem
schema: v13
index:
prefix: loki_index_
period: 24h
query_range:
cache_results: true
deploymentMode: SimpleScalable
read:
replicas: 2
resources:
requests: { cpu: 200m, memory: 256Mi }
limits: { cpu: 1000m, memory: 1Gi }
persistence:
storageClass: vsan-default-storage-policy
size: 10Gi
write:
replicas: 3
resources:
requests: { cpu: 200m, memory: 512Mi }
limits: { cpu: 1000m, memory: 2Gi }
persistence:
storageClass: vsan-default-storage-policy
size: 20Gi
backend:
replicas: 1
persistence:
storageClass: vsan-default-storage-policy
size: 10GiFluent Bit: the DaemonSet pipeline
Fluent Bit is the lightweight log processor and forwarder designed for Kubernetes. It runs as a DaemonSet — one pod per node — reading log files from the host filesystem and shipping them with Kubernetes metadata enrichment.
Full ConfigMap
apiVersion: v1
kind: ConfigMap
metadata:
  name: fluent-bit-config
  namespace: logging
data:
  fluent-bit.conf: |
    [SERVICE]
        Flush         5
        Daemon        Off
        Log_Level     info
        Parsers_File  parsers.conf
        HTTP_Server   On
        HTTP_Listen   0.0.0.0
        HTTP_Port     2020

    [INPUT]
        Name              tail
        Tag               kube.*
        Path              /var/log/containers/*.log
        Parser            cri
        DB                /run/fluent-bit/flb_kube.db
        Mem_Buf_Limit     50MB
        Skip_Long_Lines   On
        Refresh_Interval  10

    [FILTER]
        Name                kubernetes
        Match               kube.*
        Kube_URL            https://kubernetes.default.svc:443
        Kube_CA_File        /var/run/secrets/kubernetes.io/serviceaccount/ca.crt
        Kube_Token_File     /var/run/secrets/kubernetes.io/serviceaccount/token
        Kube_Tag_Prefix     kube.var.log.containers.
        Merge_Log           On
        Merge_Log_Key       log_processed
        Keep_Log            Off
        Annotations         Off
        Labels              On

    [FILTER]
        Name   grep
        Match  kube.*
        # Drop logs from the monitoring namespace to avoid feedback loops
        Exclude  $kubernetes['namespace_name'] monitoring

    [OUTPUT]
        Name            loki
        Match           kube.*
        Host            loki-gateway.logging.svc.cluster.local
        Port            80
        Labels          job=fluent-bit,namespace=$kubernetes['namespace_name'],pod=$kubernetes['pod_name'],container=$kubernetes['container_name'],node=$kubernetes['host']
        Line_Format     json
        Auto_Kubernetes_Labels Off
        Retry_Limit     False
        Batch_wait      1s
        Batch_size      1048576

  parsers.conf: |
    [PARSER]
        Name        cri
        Format      regex
        Regex       ^(?<time>[^ ]+) (?<stream>stdout|stderr) (?<logtag>[^ ]*) (?<log>.*)$
        Time_Key    time
        Time_Format %Y-%m-%dT%H:%M:%S.%L%z
DaemonSet manifest
apiVersion: apps/v1
kind: DaemonSet
metadata:
  name: fluent-bit
  namespace: logging
spec:
  selector:
    matchLabels:
      app: fluent-bit
  template:
    metadata:
      labels:
        app: fluent-bit
    spec:
      serviceAccountName: fluent-bit
      tolerations:
        - key: node-role.kubernetes.io/control-plane
          effect: NoSchedule
      containers:
        - name: fluent-bit
          image: cr.fluentbit.io/fluent/fluent-bit:3.3
          ports:
            - containerPort: 2020
              name: http-metrics
          volumeMounts:
            - name: varlog
              mountPath: /var/log
              readOnly: true
            - name: config
              mountPath: /fluent-bit/etc/
            - name: db
              mountPath: /run/fluent-bit
          resources:
            requests: { cpu: 50m, memory: 64Mi }
            limits: { cpu: 200m, memory: 256Mi }
      volumes:
        - name: varlog
          hostPath:
            path: /var/log
        - name: config
          configMap:
            name: fluent-bit-config
        - name: db
          emptyDir: {}
The monitoring namespace exclusion filter
Without the grep filter dropping logs from the monitoring namespace, Grafana and Prometheus generate logs that Fluent Bit ships to Loki, which Grafana then queries, generating more logs. The feedback loop can saturate your ingest pipeline within minutes on a busy cluster.
LogQL: querying your logs
LogQL is Loki’s query language, modeled on PromQL. It has two forms: log queries (return log lines) and metric queries (compute metrics from log lines).
Log query anatomy
{namespace="production", pod=~"api-.*"}         # stream selector (required)
| json                                           # parser: extract JSON fields
| level = "error"                               # line filter
| message =~ "timeout|connection refused"       # regex filter on extracted field
| line_format "{{.timestamp}} {{.message}}"     # format output
The stream selector {namespace="production"} is the equivalent of a Prometheus label selector — it narrows which log streams are fetched from object storage. All filters after the | are applied in-memory on the fetched chunks. This means the stream selector’s efficiency determines query performance. Always include at minimum namespace and ideally pod or container in the stream selector.
Metric query examples
# Error rate per namespace over 5 minutes
sum by(namespace) (rate({job="fluent-bit"} | json | level="error" [5m]))

# Bytes received per pod over 1 minute
sum by(pod) (bytes_rate({job="fluent-bit"}[1m]))

# P99 latency extracted from structured logs
quantile_over_time(0.99,
  {namespace="production"} | json | unwrap duration_ms [10m]
) by (service)
EFK vs PLG: the honest comparison
Storage cost
Query performance
Operational complexity
When to choose Elasticsearch
Integration with Grafana
Add Loki as a data source in Grafana under Configuration → Data Sources → Add data source → Loki. Set the URL to http://loki-gateway.logging.svc.cluster.local:80. Enable derived fields to create automatic links from log lines containing a traceId field to the corresponding trace in Tempo — this is the log-to-trace correlation that makes incident response dramatically faster.
Monitoring Fluent Bit itself
Fluent Bit exposes a Prometheus metrics endpoint on port 2020 when HTTP_Server On is set in the SERVICE block. The most useful metrics for production monitoring are:
fluentbit_input_records_total — total records read per input plugin. Monitor this rate to detect log source connectivity issues. A sudden drop to zero on the tail input indicates the DaemonSet lost access to the host log directory, usually due to a permission change or a missing volume mount.
fluentbit_output_proc_records_total — total records successfully sent per output plugin. Compare this to the input records total to calculate the pipeline success rate. A growing gap between input and output indicates output backpressure, typically caused by Loki ingestion limits being reached.
fluentbit_output_retried_records_total — records that required retry before successful delivery. Occasional retries are normal. A sustained retry rate above 1% indicates Loki is under write pressure and the Retry_Limit setting in the OUTPUT block may need adjustment. In production, setting Retry_Limit False keeps Fluent Bit retrying indefinitely rather than dropping records, but couples Fluent Bit memory usage to Loki availability.
fluentbit_output_errors_total — records that failed permanently after exhausting retries. Any non-zero value in production requires investigation. Common causes are Loki authentication failures, certificate validation errors, or label cardinality limit violations (too many unique label combinations).
Create a ServiceMonitor to scrape these metrics into Prometheus and alert on fluentbit_output_errors_total > 0 and rate(fluentbit_input_records_total[5m]) == 0 per node — the second condition catches a completely silent Fluent Bit pod, which is worse than a noisy failure because it produces no visible error signal.
Production tuning checklist
Before marking a Loki and Fluent Bit deployment as production-ready, verify the following configuration points.
The max_label_names_per_series setting in Loki’s limits_config caps how many distinct labels a single log stream can carry. The default is 15. Fluent Bit’s Kubernetes filter can attach many labels if Labels On is set and the pod carries many Kubernetes labels. Audit your highest-label-count pods and set max_label_names_per_series to their count plus two. Exceeding this limit causes Loki to reject the log stream with a 429 error, silently dropping logs from affected pods.
The Mem_Buf_Limit in the Fluent Bit INPUT block limits the in-memory buffer for log tailing. When Loki is unavailable and Retry_Limit False is set, Fluent Bit accumulates records in memory until this limit is reached. At 50 MB per node with 30 nodes, you have 1.5 GB of buffered logs during a Loki outage before data loss begins. Size this limit based on your acceptable data loss window versus your node memory budget.
The DB parameter on the tail INPUT specifies the SQLite database file where Fluent Bit tracks the read position (inode + offset) for each log file. Without this, every Fluent Bit pod restart re-reads all log files from the beginning, potentially shipping gigabytes of duplicate logs to Loki. Mount the DB path on an emptyDir volume so it survives pod restarts but not node reboots. If surviving node reboots is required, use a hostPath volume with appropriate cleanup logic.
References.
- Loki documentation — official architecture reference, configuration parameters, and LogQL specification
- Fluent Bit documentation — INPUT/FILTER/OUTPUT plugin reference, Kubernetes filter configuration
- LogQL reference — complete syntax reference for log and metric queries
- Loki storage documentation — backend options, schema configuration, retention
Get the next one by email
New articles and series, sent when they are published. No other mail.