
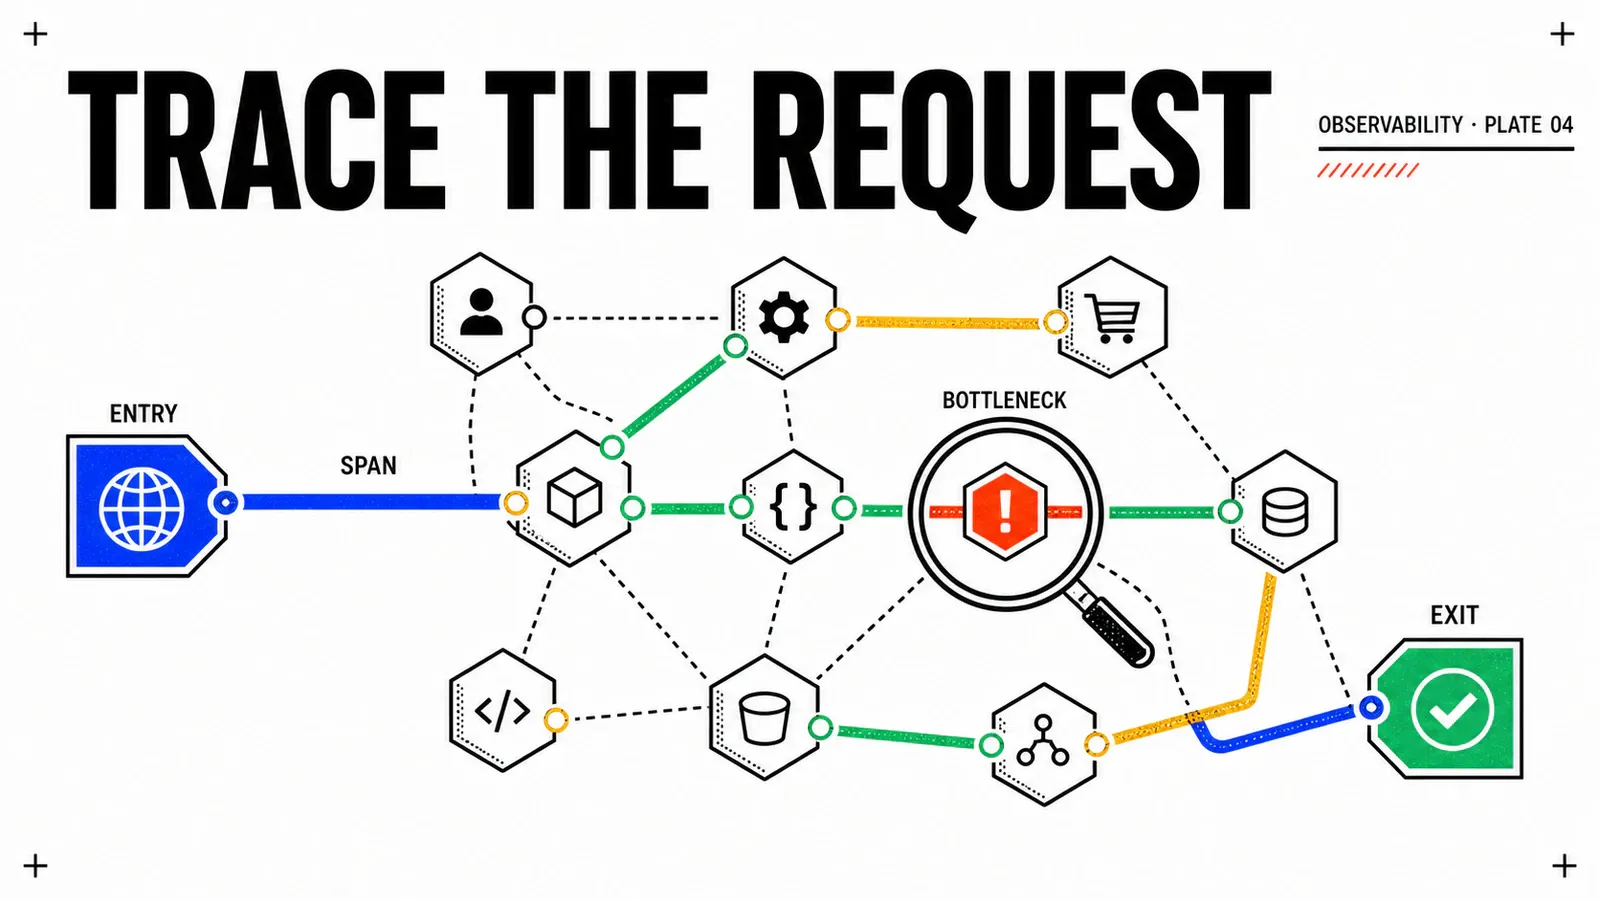
Distributed tracing answers the question that metrics and logs cannot fully answer: in a request that touched seven services over 400ms, which service was responsible for 320ms of that latency? Metrics tell you the overall P99 degraded. Logs tell you each service received the request. Only a trace shows you the exact span where time was lost.
OpenTelemetry has become the CNCF-standardised answer to trace collection. It provides language-independent APIs, auto-instrumentation agents for major runtimes, a vendor-neutral wire protocol (OTLP), and the Collector as a flexible processing pipeline. This article covers deploying OpenTelemetry on VKS: the Collector configuration, auto-instrumentation setup, sampling strategy, and the integration with Prometheus exemplars that creates the metric-to-trace correlation loop.
The OpenTelemetry data model for traces
The OTel trace specification defines the following core concepts:
Trace — a set of spans sharing a root span and a common traceId (16-byte random identifier). The trace represents one end-to-end distributed operation.
Span — the atomic unit of work within a trace. Each span carries:
traceId— identifies the tracespanId— uniquely identifies this span (8 bytes)parentSpanId— references the parent span (absent for root spans)name— human-readable operation name (e.g.HTTP GET /api/users)kind— one ofINTERNAL,SERVER,CLIENT,PRODUCER,CONSUMERstartTime/endTime— nanosecond timestampsstatus—OK,ERROR, orUNSETattributes— key-value pairs (max 128 per span in OTel SDK defaults)events— timestamped annotations within the spanlinks— references to causally related spans in other traces
Context propagation — the mechanism that passes trace context (traceId + spanId) across service boundaries. HTTP requests use the traceparent header (W3C Trace Context standard). Kafka messages use the W3C Baggage header. gRPC uses metadata. Auto-instrumentation agents handle context injection and extraction automatically.
The OTLP protocol
The OpenTelemetry Protocol (OTLP) is the standard wire format for OTel signals. It supports gRPC (default port 4317) and HTTP/Protobuf (default port 4318). OTLP carries all three signal types (traces, metrics, logs) on the same connection.
# OTLP receiver configuration in the OTel Collector
receivers:
  otlp:
    protocols:
      grpc:
        endpoint: 0.0.0.0:4317
      http:
        endpoint: 0.0.0.0:4318
The SDK sends spans in batches via OTLP. The Collector receives, processes, and exports them. This decoupling is the core value of the Collector architecture — applications only need to know the Collector endpoint, not the backend topology.
Deploying the OpenTelemetry Collector
The OTel Collector pipeline has four component types: receivers, processors, exporters, and extensions. The Collector configuration schema defines these as named maps.
helm repo add open-telemetry https://open-telemetry.github.io/opentelemetry-helm-charts
helm repo update

helm upgrade --install otel-collector open-telemetry/opentelemetry-collector \
  --namespace observability \
  --create-namespace \
  --values otel-collector-values.yaml
# otel-collector-values.yaml
mode: deployment # Use daemonset for host-level telemetry
config:
receivers:
otlp:
protocols:
grpc:
endpoint: 0.0.0.0:4317
http:
endpoint: 0.0.0.0:4318
# Prometheus receiver: scrape Prometheus endpoints from the Collector
prometheus:
config:
scrape_configs:
- job_name: "otel-collector"
static_configs:
- targets: ["0.0.0.0:8888"]
processors:
memory_limiter:
check_interval: 1s
limit_mib: 800
spike_limit_mib: 200
batch:
send_batch_size: 512
timeout: 5s
# Tail-based sampling: only keep interesting traces
tail_sampling:
decision_wait: 10s
num_traces: 100000
policies:
- name: errors-policy
type: status_code
status_code: { status_codes: [ERROR] }
- name: slow-traces-policy
type: latency
latency: { threshold_ms: 1000 }
- name: probabilistic-policy
type: probabilistic
probabilistic: { sampling_percentage: 5 }
exporters:
# Tempo: Grafana trace backend
otlp/tempo:
endpoint: tempo.observability.svc.cluster.local:4317
tls:
insecure: true
# Jaeger (alternative)
# jaeger:
# endpoint: jaeger-collector.observability.svc.cluster.local:14250
# tls:
# insecure: true
# Prometheus exemplars export
prometheusremotewrite:
endpoint: http://kube-prometheus-stack-prometheus.monitoring.svc.cluster.local:9090/api/v1/write
extensions:
health_check:
endpoint: 0.0.0.0:13133
pprof:
endpoint: 0.0.0.0:1777
service:
extensions: [health_check, pprof]
pipelines:
traces:
receivers: [otlp]
processors: [memory_limiter, tail_sampling, batch]
exporters: [otlp/tempo]
metrics:
receivers: [otlp, prometheus]
processors: [memory_limiter, batch]
exporters: [prometheusremotewrite]Tail-based sampling requires stateful routing
The tail_sampling processor needs to see all spans of a trace before making a sampling decision. In a multi-replica Collector deployment, all spans for the same traceId must route to the same Collector instance. Use the loadbalancingexporter or a sticky load balancer in front of the Collector replicas, or switch to head-based sampling if you can tolerate sampling decisions made at trace start.
Auto-instrumentation with the OTel Operator
The OpenTelemetry Operator for Kubernetes enables zero-code instrumentation by injecting language-specific auto-instrumentation agents as init containers. This avoids requiring application teams to modify their code.
helm upgrade --install opentelemetry-operator open-telemetry/opentelemetry-operator \
  --namespace observability \
  --set "manager.collectorImage.repository=otel/opentelemetry-collector-contrib"
Create an Instrumentation resource that defines the SDK configuration:
apiVersion: opentelemetry.io/v1alpha1
kind: Instrumentation
metadata:
  name: otel-instrumentation
  namespace: production
spec:
  # Collector endpoint for all instrumented pods
  exporter:
    endpoint: http://otel-collector.observability.svc.cluster.local:4318

  propagators:
    - tracecontext
    - baggage
    - b3    # Add B3 for services that still use Zipkin-style propagation

  sampler:
    type: parentbased_traceidratio
    argument: "0.10"   # 10% head-based sampling at SDK level

  java:
    image: ghcr.io/open-telemetry/opentelemetry-operator/autoinstrumentation-java:2.x
    env:
      - name: OTEL_INSTRUMENTATION_JDBC_ENABLED
        value: "true"
      - name: OTEL_INSTRUMENTATION_SPRING_WEBMVC_ENABLED
        value: "true"

  python:
    image: ghcr.io/open-telemetry/opentelemetry-operator/autoinstrumentation-python:0.x

  nodejs:
    image: ghcr.io/open-telemetry/opentelemetry-operator/autoinstrumentation-nodejs:0.x

  go:
    image: ghcr.io/open-telemetry/opentelemetry-operator/autoinstrumentation-go:0.x
Annotate deployments to enable auto-instrumentation:
# In the Deployment pod template metadata
annotations:
  instrumentation.opentelemetry.io/inject-java: "production/otel-instrumentation"
  # Or for Python: instrumentation.opentelemetry.io/inject-python: "production/otel-instrumentation"
The Operator webhook intercepts pod creation and injects the agent init container and required environment variables (OTEL_EXPORTER_OTLP_ENDPOINT, OTEL_SERVICE_NAME, OTEL_RESOURCE_ATTRIBUTES). Application pods start instrumented without any code change.
Sampling strategy
Sampling is the practice of recording only a fraction of traces. Without sampling, a production system producing 10,000 requests per second generates 10,000 root spans per second — far too many to store and query efficiently.
Decision made at trace start. The root span decides whether the trace is sampled, and all downstream spans inherit that decision via context propagation. Simple and stateless — no Collector coordination required.
Limitation: you cannot retroactively keep a trace because it turned out to be interesting (slow, erroring). You commit before you know the outcome. Use a low rate (1-10%) for baseline visibility and rely on error filtering to catch failures.
Recommendation: use head-based sampling when simplicity is more important than guaranteed error capture.
Decision made after the trace completes. The Collector buffers all spans for a configurable window (10-30 seconds), then applies policies: keep all error traces, keep all slow traces, keep N% of the rest.
Advantage: you never miss an error or slow trace. The representative subset you keep contains exactly the traces that matter operationally.
Limitation: stateful, requires routing all spans of the same trace to the same Collector instance. Adds latency to the decision (the buffer window).
Recommendation: use tail-based sampling for production observability where error traces must never be dropped. Size the buffer for 2x peak trace rate × decision window.
Inherits the parent span’s sampling decision. If the root span is sampled, all child spans are sampled. If not, none are. This is the OTel SDK default (parentbased_traceidratio) and enables consistent sampling across heterogeneous service fleets where some services run with auto-instrumentation and others with manual SDK calls.
Exemplar correlation: metrics to traces
Prometheus exemplars are the mechanism that connects a histogram observation to a specific trace. When an application records a request latency in a histogram bucket, it can attach a traceId to that measurement. Prometheus stores the exemplar alongside the histogram bucket. Grafana renders the exemplar as a clickable overlay on the chart, linking to the trace in Tempo.
The OTel Java agent automatically attaches exemplars to Micrometer/Prometheus histograms when both Prometheus and OTel instrumentation are active. For manual instrumentation, use the SDK’s exemplar API:
// Java: attach exemplar to a Prometheus histogram observation
histogram.record(latencyMs, Attributes.of(
    AttributeKey.stringKey("http.method"), "GET",
    AttributeKey.stringKey("http.route"), "/api/products"
));
// The SDK automatically injects the current trace context as exemplar
Enable exemplar storage in Prometheus (enableFeatures: [exemplar-storage] in kube-prometheus-stack values) and configure Grafana’s Tempo data source with the TraceQL exemplar query. The result: from a Grafana panel showing P99 latency, click any spike and land directly on the trace responsible.
Tempo as the trace backend
Grafana Tempo stores traces in object storage (S3, GCS, or vSAN Object Storage) and provides a TraceQL query API consumed exclusively by Grafana Explore. It has no standalone trace UI.
helm upgrade --install tempo grafana/tempo \
  --namespace observability \
  --set storage.trace.backend=local \
  --set storage.trace.local.path=/var/tempo \
  --set persistence.enabled=true \
  --set persistence.storageClassName=vsan-default-storage-policy \
  --set persistence.size=50Gi
For large trace volumes, switch storage.trace.backend to s3 and configure an S3-compatible endpoint. vSAN Object Storage with S3 API compatibility works as a backend, keeping trace data on-premises.
References.
- OpenTelemetry Specification — Tracing — span data model, context propagation, sampling
- OTLP Specification — wire protocol for traces, metrics, and logs
- OTel Collector configuration — receivers, processors, exporters, service pipeline
- OTel Operator documentation — auto-instrumentation, Instrumentation CRD
- Grafana Tempo documentation — storage backends, TraceQL, Exemplar integration
Get the next one by email
New articles and series, sent when they are published. No other mail.