
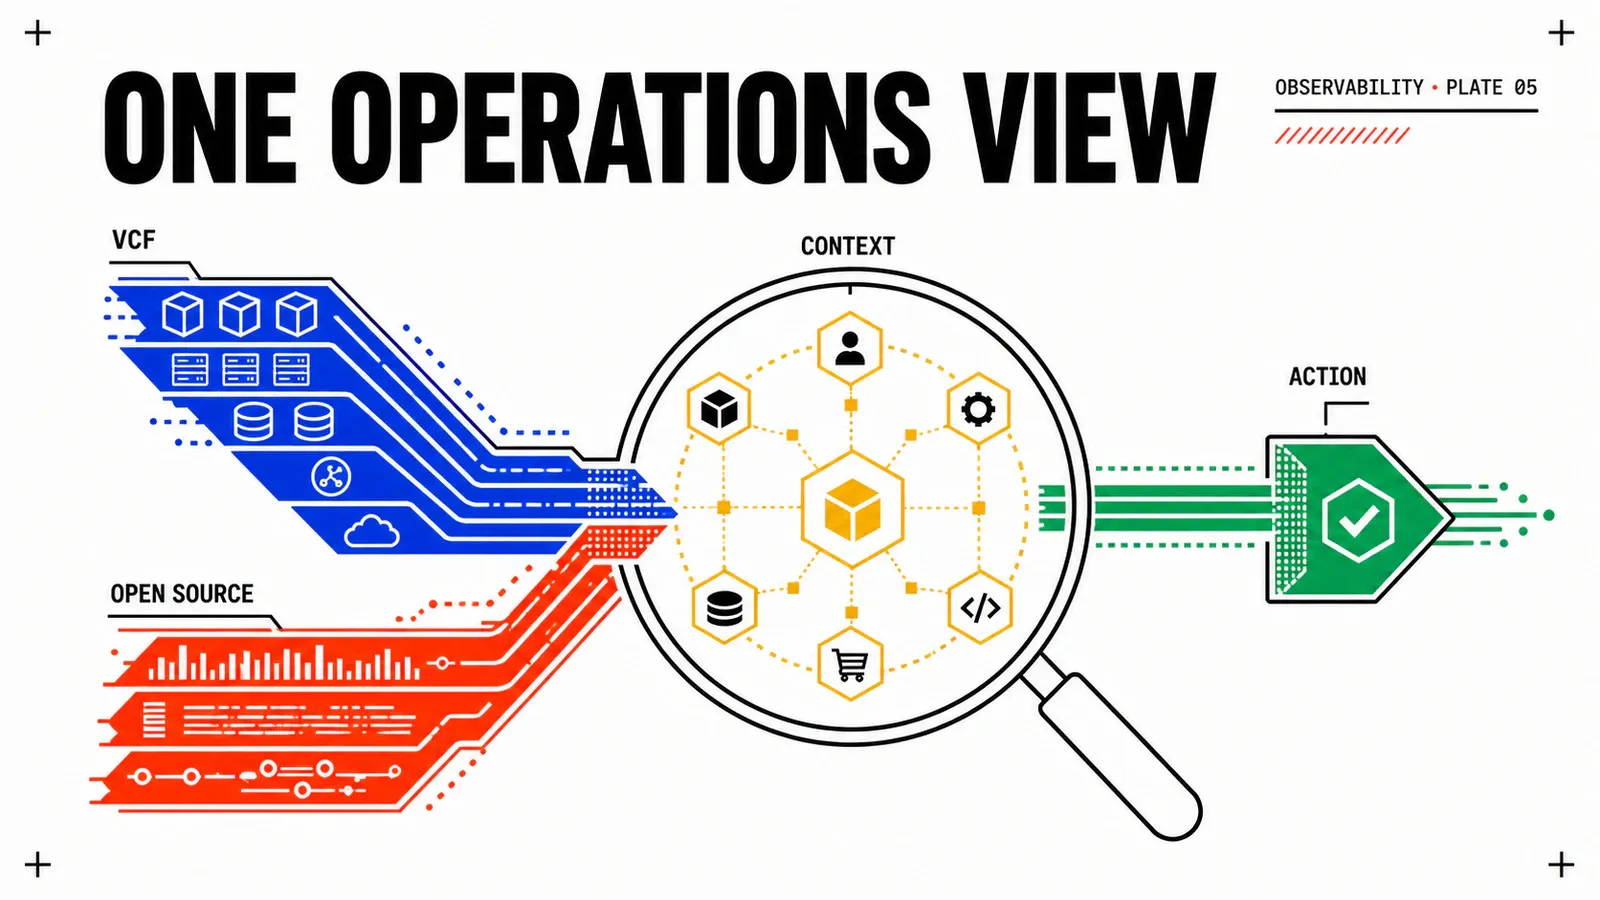
The previous articles in this series deployed Prometheus, Loki, and the OpenTelemetry Collector to cover Kubernetes-layer observability. But in a VCF environment, the story doesn’t start at the pod. It starts at the physical host, the vSAN datastore, the NSX segment. The infrastructure layer has its own observability tool: VMware Aria Operations (formerly vRealize Operations).
The challenge is that Aria Operations and Prometheus live in separate silos. Your infrastructure team opens vROps to look at ESXi CPU contention. Your platform team opens Grafana to look at pod scheduling pressure. Nobody is looking at both simultaneously and asking: is this pod latency spike caused by vSAN I/O contention on the underlying datastore? Bridging this gap is what this article addresses.
Aria Operations architecture overview
Aria Operations is an analytics and intent-driven operations platform for VMware infrastructure. Its data model is built around objects (managed entities) and metrics (time-series data attached to objects).
The object hierarchy maps the vSphere object model:
HostSystem— ESXi hostClusterComputeResource— vSphere clusterDatastore— storage backing (vSAN or NFS/VMFS)VirtualMachine— individual VMNSX-T Data Center— NSX management planeLogicalSwitch— NSX segment
Each object type exposes a set of metrics keys following the pattern object_type|metric_group|metric_name. For a HostSystem, the most operationally relevant metric keys include:
cpu|cpuDemand_average              — CPU demand percentage (0-100)
cpu|ready_summation                — CPU Ready: time a vCPU waited for physical CPU
mem|usage_average                  — Memory utilization percentage
mem|swapped_average                — MB of memory swapped (non-zero = memory pressure)
disk|commandsAveraged_average      — Average I/O operations per second
net|packetsDroppedRx_summation     — Received packets dropped (network pressure indicator)
For ClusterComputeResource:
cpu|effectivecpu_average           — Effective CPU capacity after HA reservations
mem|effectivemem_average           — Effective memory after HA reservations
cluster|effectiveHostsTotal_latest — Number of responsive hosts in cluster
vROps metric naming convention
Aria Operations uses a |-separated hierarchy for metric keys, not the . convention of Prometheus. When exporting to Prometheus via remote_write, metric key names are sanitised: | becomes _, and special characters are dropped. The resulting Prometheus metric name is aria_hostsystem_cpu_cpudemand_average.
Exporting Aria Operations metrics to Prometheus
Aria Operations does not natively expose a Prometheus /metrics endpoint. There are two integration paths.
Path 1: Prometheus remote_write from Aria Operations
Since Aria Operations 8.14, Broadcom introduced native outbound metric streaming capabilities. The vRealize Operations Management Pack for Prometheus (available on the Broadcom Marketplace) adds a Prometheus exporter endpoint to Aria Operations that Prometheus can scrape. Alternatively, Aria Operations’ REST API can be polled by an external adapter.
Path 2: vsphere-exporter (Prometheus community)
The vmware/vsphere-graphite project and the community pryorda/vmware_exporter provide Prometheus exporters that poll the vSphere API directly. These work without Aria Operations and are suitable when you want infrastructure metrics in Prometheus without the full Aria Operations stack.
# Deploy vmware_exporter as a Deployment in the monitoring namespace
apiVersion: apps/v1
kind: Deployment
metadata:
  name: vmware-exporter
  namespace: monitoring
spec:
  replicas: 1
  selector:
    matchLabels:
      app: vmware-exporter
  template:
    metadata:
      labels:
        app: vmware-exporter
        # Enable Prometheus scraping
        prometheus.io/scrape: "true"
        prometheus.io/port: "9272"
    spec:
      containers:
        - name: vmware-exporter
          image: pryorda/vmware_exporter:latest
          ports:
            - containerPort: 9272
              name: metrics
          env:
            - name: VSPHERE_HOST
              valueFrom:
                secretKeyRef:
                  name: vcenter-credentials
                  key: host
            - name: VSPHERE_USER
              valueFrom:
                secretKeyRef:
                  name: vcenter-credentials
                  key: username
            - name: VSPHERE_PASSWORD
              valueFrom:
                secretKeyRef:
                  name: vcenter-credentials
                  key: password
            - name: VSPHERE_IGNORE_SSL
              value: "false"
          resources:
            requests: { cpu: 100m, memory: 128Mi }
            limits: { cpu: 500m, memory: 512Mi }
Create a ServiceMonitor to have Prometheus scrape the exporter:
apiVersion: monitoring.coreos.com/v1
kind: ServiceMonitor
metadata:
  name: vmware-exporter
  namespace: monitoring
  labels:
    release: kube-prometheus-stack
spec:
  selector:
    matchLabels:
      app: vmware-exporter
  endpoints:
    - port: metrics
      interval: 60s    # vSphere metrics have minute-level granularity; 60s is appropriate
      scrapeTimeout: 30s
Aria Operations REST API
For environments with Aria Operations fully deployed, the Aria Operations REST API provides programmatic access to all collected metrics. The API follows a RESTful design with JSON payloads.
# Authenticate and obtain a token
curl -s -X POST https://aria-ops.example.com/suite-api/api/auth/token/acquire \
  -H "Content-Type: application/json" \
  -d '{"username":"admin","password":"<password>","authSource":"LOCAL"}' \
  | jq '.token'

# Query metrics for a specific object (HostSystem)
curl -s -X GET "https://aria-ops.example.com/suite-api/api/resources?resourceKind=HostSystem" \
  -H "Authorization: vRealizeOpsToken <token>" \
  -H "Accept: application/json" \
  | jq '.resourceList[].identifier'

# Fetch metric data for the last hour
curl -s -X POST "https://aria-ops.example.com/suite-api/api/resources/stats/query" \
  -H "Authorization: vRealizeOpsToken <token>" \
  -H "Content-Type: application/json" \
  -d '{
    "resourceId": ["<host-resource-id>"],
    "statKey": ["cpu|ready_summation", "cpu|cpuDemand_average", "mem|swapped_average"],
    "begin": '"$(date -d '1 hour ago' +%s%3N)"',
    "end": '"$(date +%s%3N)"'
  }'
This API is the foundation for building custom exporters that bridge Aria Operations data into Prometheus for any metric not covered by the community exporters.
Building unified Grafana dashboards
The power of the integrated stack emerges in unified dashboards that correlate infrastructure metrics (from Aria Operations via vmware_exporter or API) with Kubernetes metrics (from Prometheus), logs (from Loki), and traces (from Tempo).
VCF Host to Pod correlation dashboard
vSAN to PVC latency correlation
NSX to Pod networking dashboard
SLO tracking across infrastructure and application
Alerting across both stacks
With Aria Operations alerting and Prometheus Alertmanager both active, you risk duplicate notifications. The recommended approach is to route alerts by domain:
- Infrastructure alerts (host down, vSAN degraded, NSX gateway unreachable, datastore capacity above 85%) are handled exclusively by Aria Operations native alerting → PagerDuty/ServiceNow.
- Kubernetes and application alerts (pod crash loops, deployment replica mismatch, high error rates, SLO burn) are handled by Prometheus Alertmanager → Slack/PagerDuty.
The integration point is a shared incident management system (PagerDuty, ServiceNow) that correlates alerts from both sources using the common hostname or cluster label as a correlation key.
The complete observability matrix for VCF
After deploying all five components covered in this series, your VCF platform has end-to-end observability:
Aria Operations — vSphere host, cluster, vSAN, NSX infrastructure metrics. Native vROps alerting and capacity analytics. Source of truth for infrastructure layer.
Prometheus + kube-prometheus-stack — Kubernetes component health, node resource usage, pod metrics, application custom metrics via ServiceMonitor. PromQL for alerting and dashboards.
Grafana — Unified query and dashboard layer. Datasources: vmware_exporter (vSphere), Prometheus (K8s + apps), Loki (logs), Tempo (traces). Single pane across all layers.
Loki + Fluent Bit — Structured pod logs with Kubernetes metadata enrichment. LogQL queries. Log-to-trace correlation via traceId derived fields.
OTel Collector + Tempo — Distributed traces from instrumented applications. Tail-based sampling. Exemplar correlation from Prometheus histograms to trace waterfalls.
No single observability incident requires opening more than one tool. Grafana unifies all signal types. The infrastructure to application correlation is one variable away.
References.
- Broadcom TechDocs — Aria Operations 8.18 — official product documentation, metric taxonomy, REST API reference
- Aria Operations REST API Reference — auth, resource queries, metric streaming endpoints
- vmware_exporter for Prometheus — community Prometheus exporter for vSphere metrics
- Grafana — Connecting data sources — configuring Prometheus, Loki and Tempo data sources
- Prometheus remote_write specification — wire format for metric ingestion from external sources
Get the next one by email
New articles and series, sent when they are published. No other mail.