observability-vcf-k8s · 5 articles
Observability as Code on VCF & Kubernetes
Metrics, logs and traces for VCF and VKS: Prometheus, Grafana, Loki, OpenTelemetry and Aria Operations to instrument your platform end-to-end.
Every article
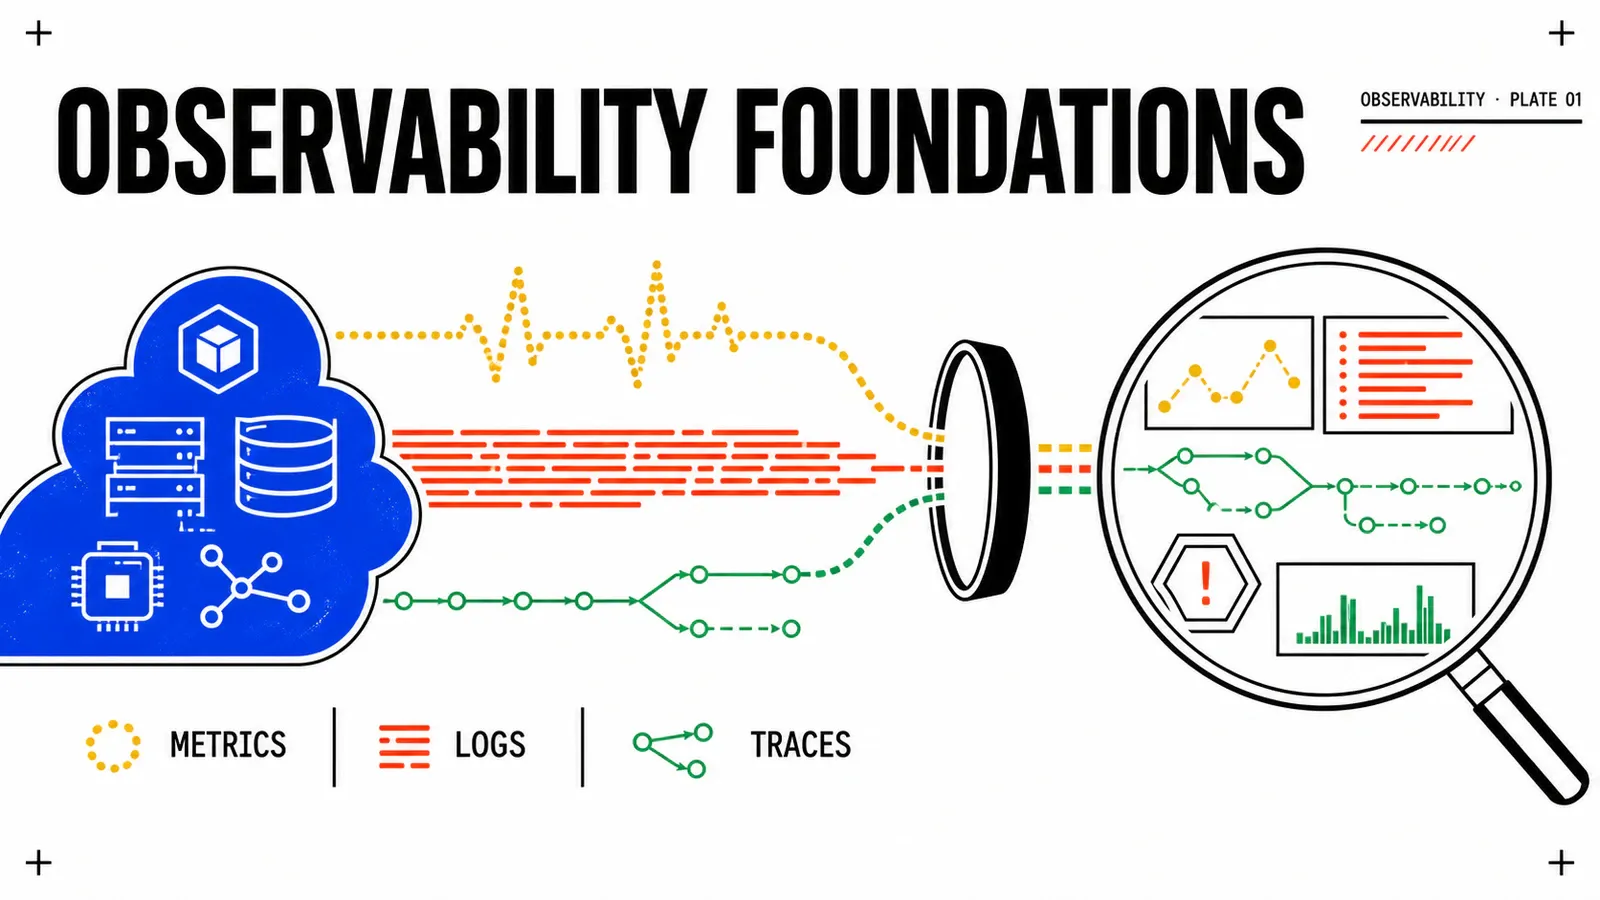
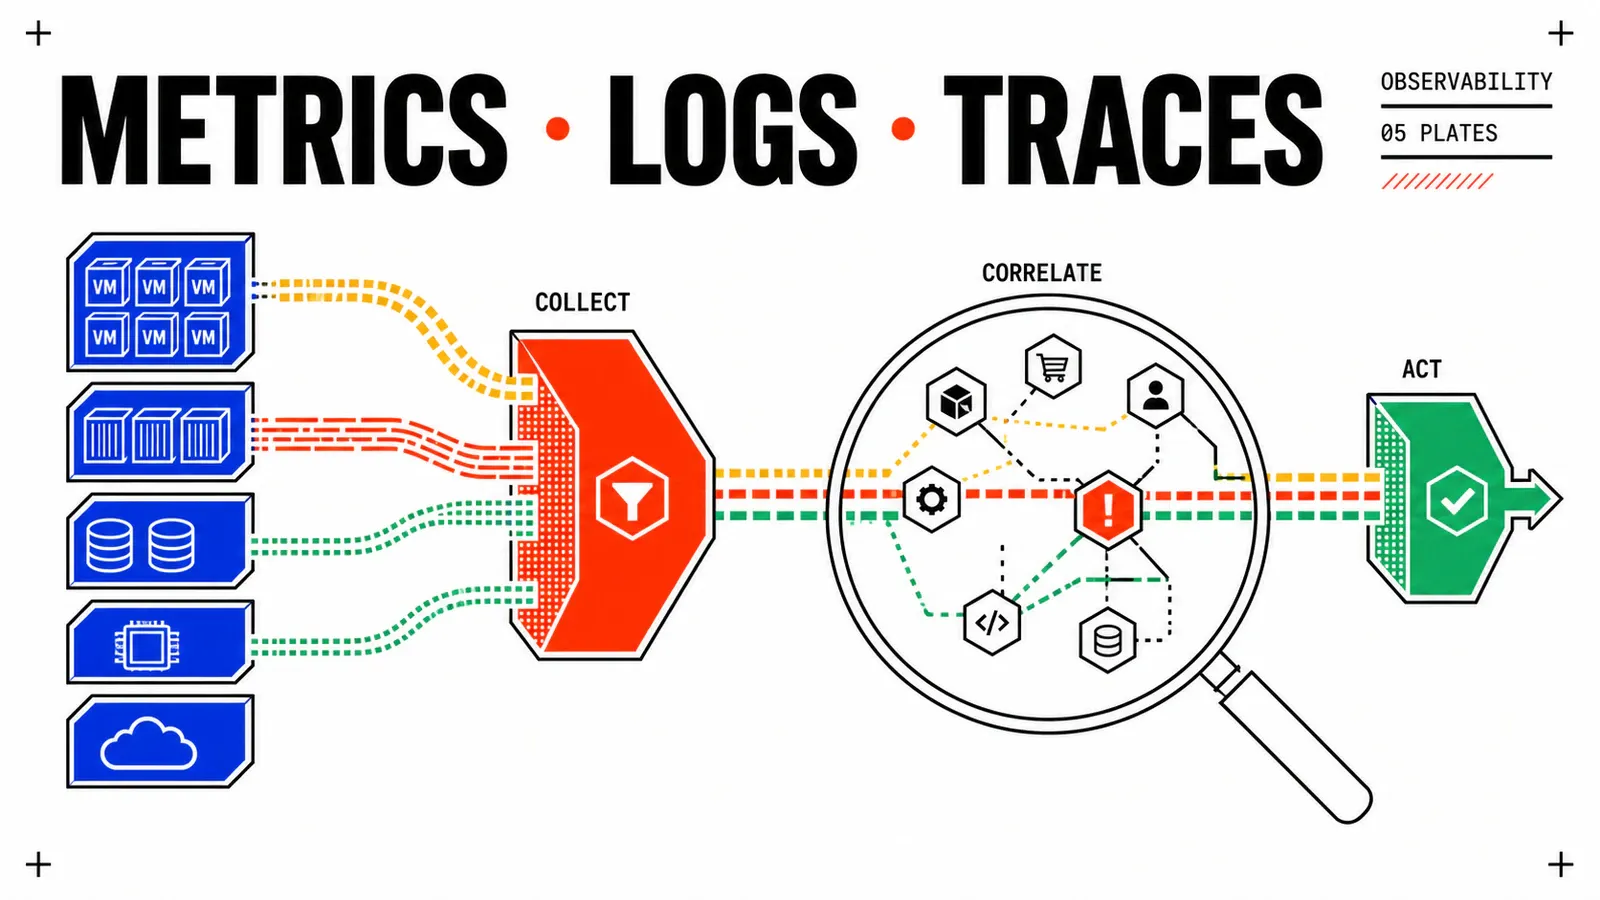
Observability foundations for VCF: metrics, logs and traces
The three pillars of observability defined by the OpenTelemetry specification, why they matter for VCF and VKS, and how to choose the right tool for each.
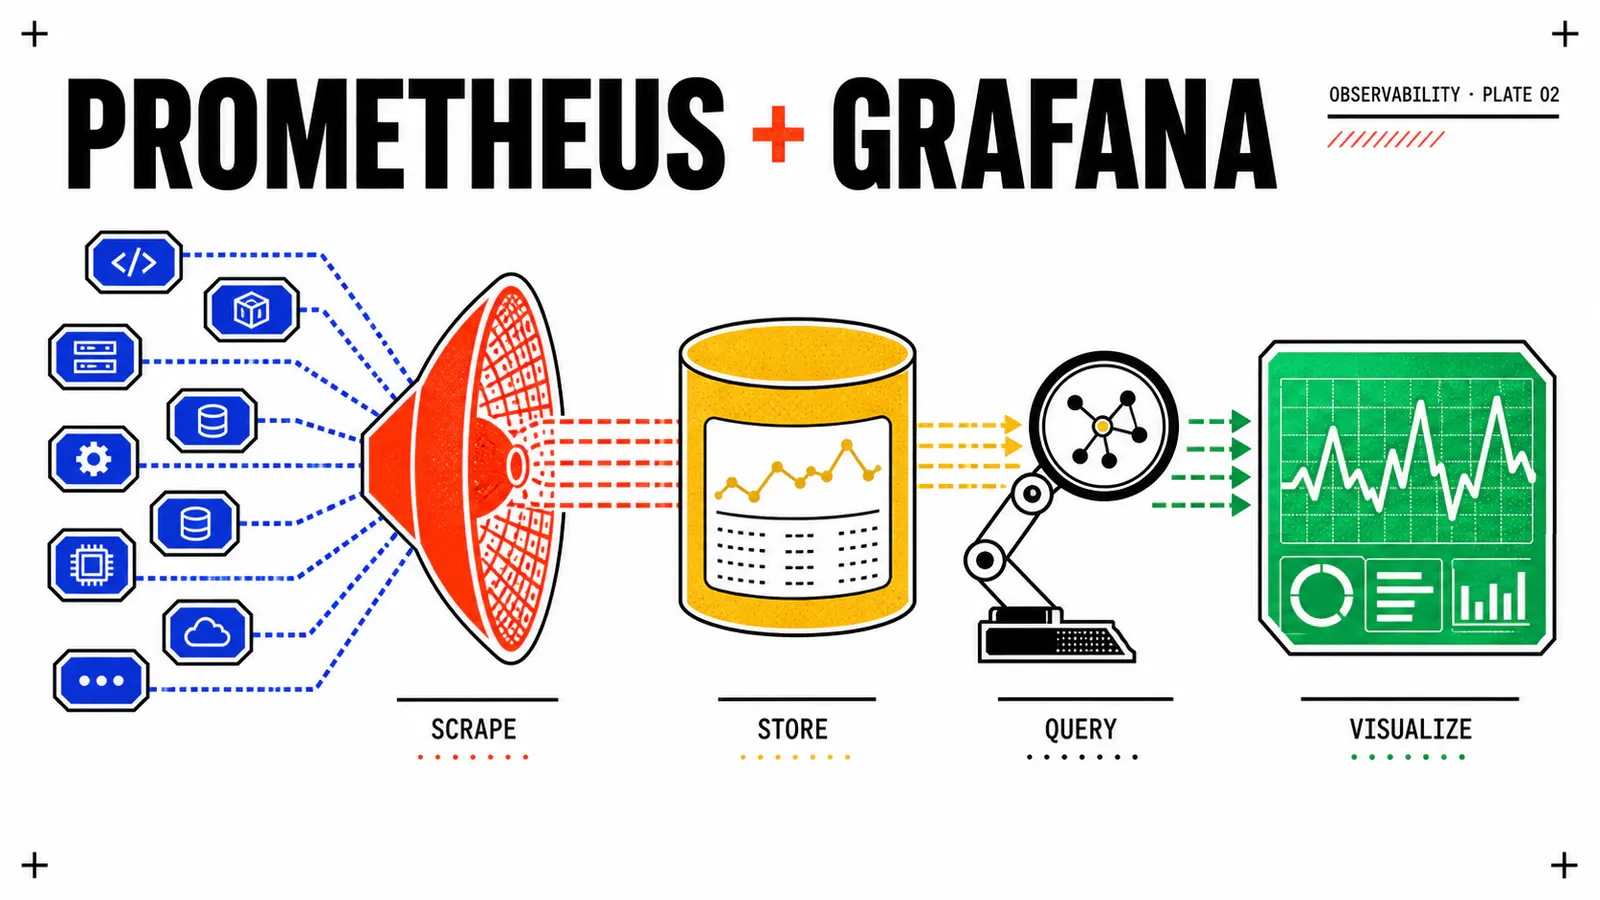
Prometheus & Grafana on VKS: the production monitoring stack
Deploy kube-prometheus-stack on VKS, configure ServiceMonitors and PodMonitors, set up alerting, and integrate with Grafana dashboards — an annotated production guide.
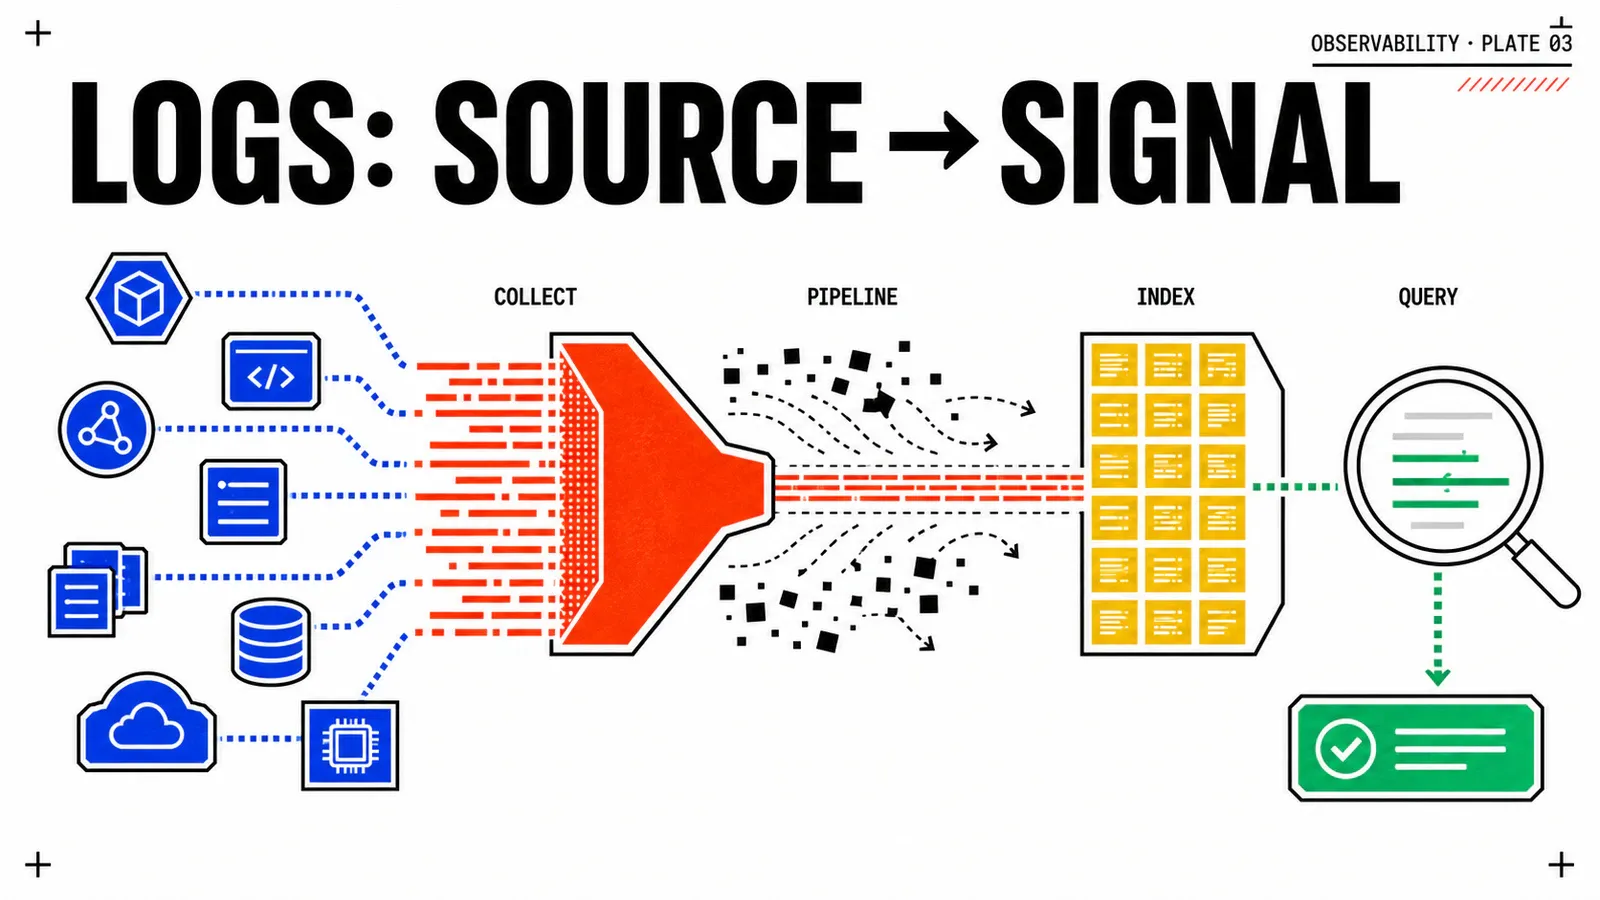
Centralised logging with Loki and Fluent Bit on VCF
Build the PLG logging stack on VCF and VKS: deploy Fluent Bit as a DaemonSet, configure its pipeline stages, ship logs to Loki, and query them with LogQL.
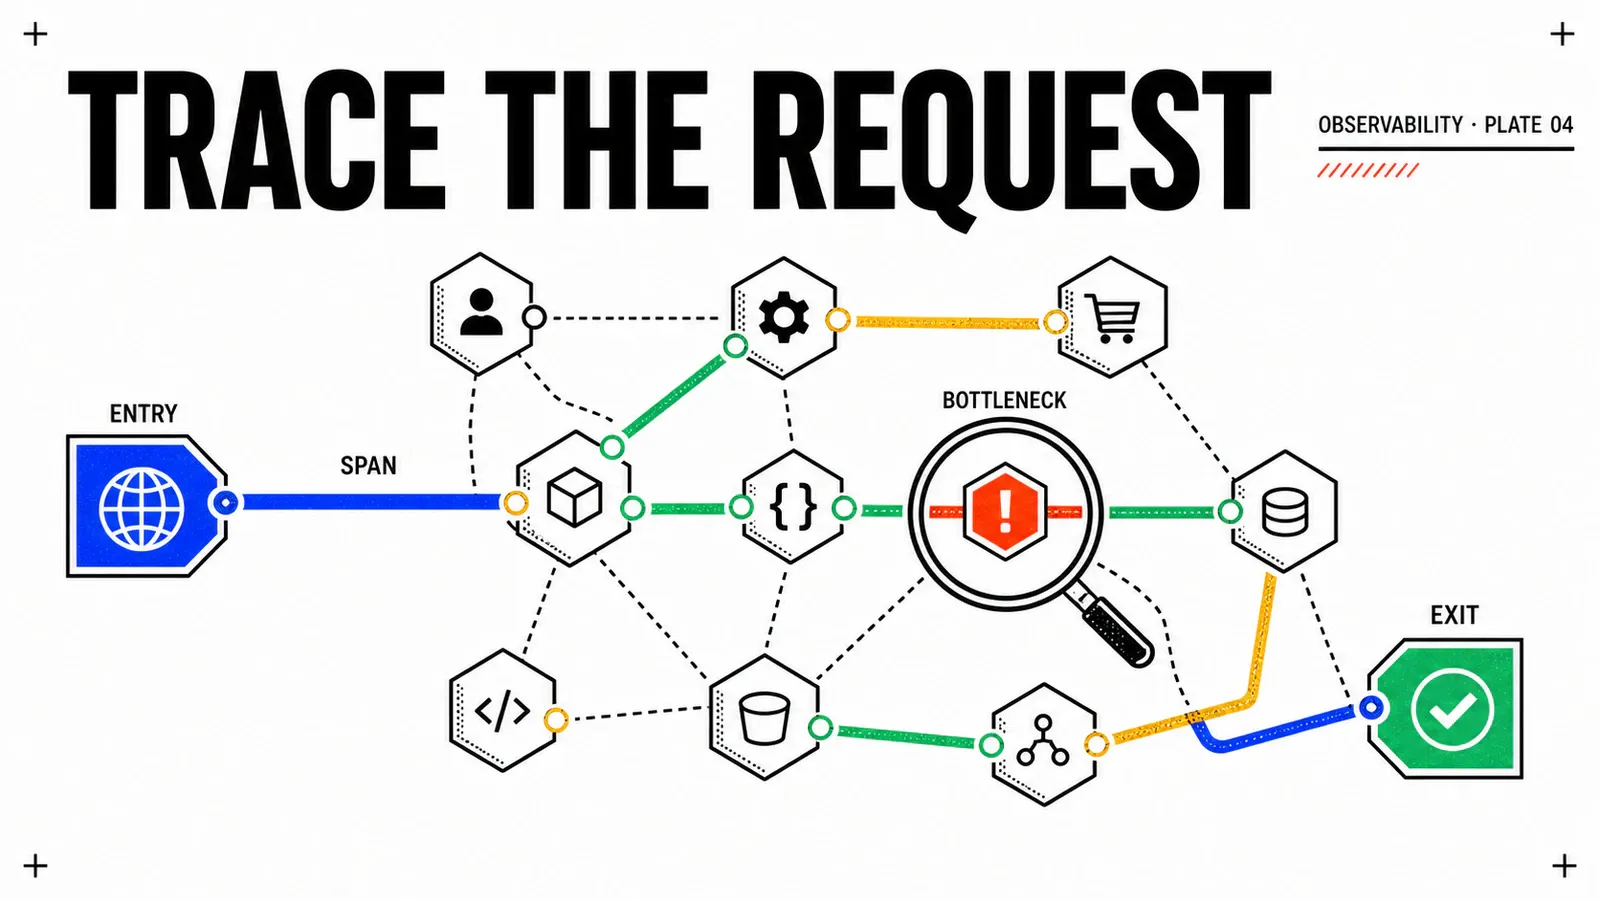
OpenTelemetry on Kubernetes: distributed tracing for cloud-native apps
Configure the OTel Collector pipeline on VKS, instrument applications with auto-instrumentation agents, export traces to Tempo or Jaeger, and correlate traces with Prometheus exemplars.
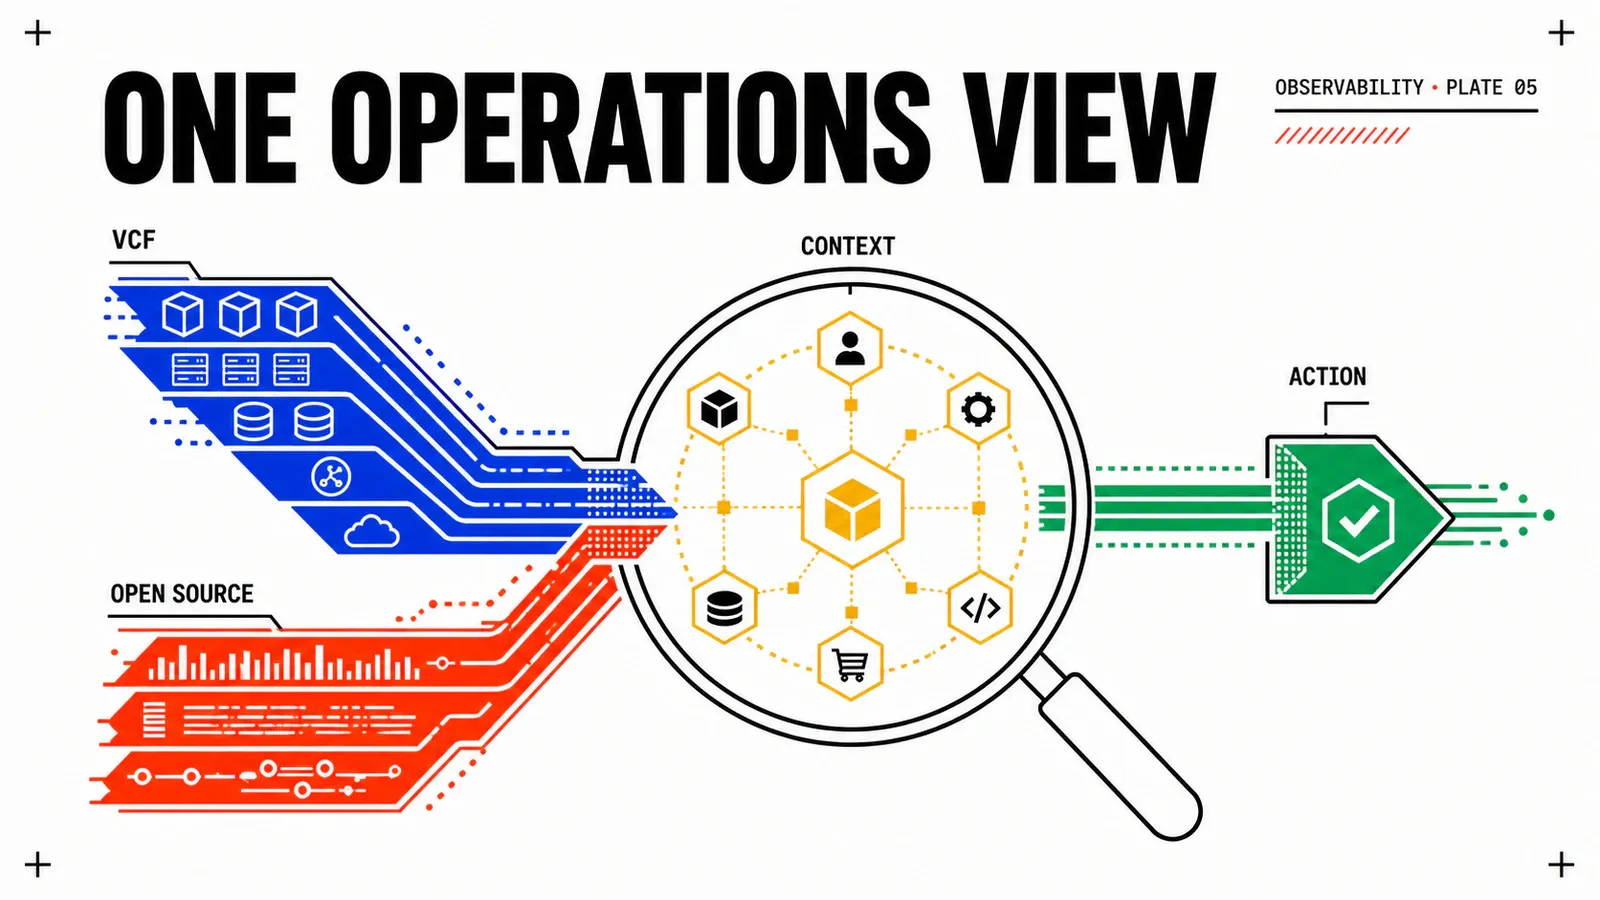
Aria Operations meets open source: unified observability for VCF
Connect VMware Aria Operations to Prometheus via remote_write, enrich Grafana with vSphere infrastructure metrics, and build unified dashboards that correlate VCF infra with Kubernetes workloads.